Precious metals surge: Silver hits record high, gold poised for breakout – Market analysis under macro expectation shift
Keywords: precious metals, gold, silver, record high, Federal Reserve, risk appetite, macro expectations
Introduction
In early December 2026, the global precious metals market experienced a breakout rally. Silver took the lead in breaking above the nominal all-time high of $58 per ounce, while gold quickly stabilized near $4,232 after a brief profit-taking, gathering momentum ahead of the upcoming Fed meeting. Early this week, gold touched a six-week high of $4,265, and although it subsequently pulled back to $4,164, it quickly rebounded to the $4,200 level, with year-to-date gains still at around 60%. This synchronized upward movement not only reflects a sharp rise in market risk appetite but also indicates a deep shift in macro expectations – from the struggle between inflation and recession to a consensus on asset repricing after monetary policy pivots.
1. Macro background shift: Resonance of risk appetite and rate cut expectations
The current strong performance of precious metal prices is rooted in a fundamental turning point in the global macro environment. After more than a year of aggressive rate hikes, the market has formed a clear expectation of the Fed's monetary policy path: the mid-December FOMC meeting is very likely to announce a pause in rate hikes and signal the start of a rate-cutting cycle in 2027. This expectation is driving the real interest rate center downward, and the historically negative correlation between real interest rates and gold prices constitutes the core driving force for gold price increases.
At the same time, global risk appetite has significantly rebounded. US economic data shows signs of a "soft landing": the labor market remains resilient, but inflationary pressures are gradually easing. This "Goldilocks" macro combination has greatly stimulated investors' demand for risk assets. Silver, with both industrial and financial attributes, is particularly strongly supported on the industrial demand side by green transformation demands such as solar energy and new energy vehicles. When macro liquidity expectations improve and industrial demand expands in resonance, silver's elasticity naturally far exceeds that of gold.
2. Silver hits record high: Dual explosion of industrial and financial attributes
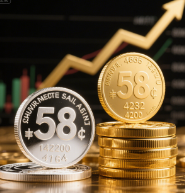
Silver's breakthrough above the nominal all-time high of $58 per ounce in this round is symbolic. The previous record high (about $49) still needs to consider inflation factors, but this time, breaking the record in nominal terms essentially reflects a fundamental change in the supply-demand structure of the silver market.
From a financial attribute perspective, although silver's monetary attribute is not as strong as gold, its price elasticity is greater. Under the expectation of a rate-cutting cycle, silver, as a low-barrier precious metal investment variety, has attracted a large inflow of retail funds and safe-haven capital. Silver ETF holdings have grown by more than 15% in the past two months, and the COT report shows speculative net long positions hit a near five-year high.
From an industrial attribute perspective, silver demand in the photovoltaic field has grown particularly astonishingly. Global solar PV installations continue to exceed expectations, with each megawatt of PV modules requiring about 20 tonnes of silver as the core material for conductive paste. According to the International Silver Institute, global industrial silver demand is expected to grow 12% year-on-year in 2026, with the photovoltaic sector accounting for more than 30%. The supply-demand gap continues to widen, and inventory levels have fallen to historic lows. COMEX silver inventories have fallen by more than 40% since 2025, and LBMA inventory data also shows continuous destocking.
Silver's breakthrough marks the acceleration phase of the precious metal bull market from "gold alone rising" to "both gold and silver soaring." Historically, silver's gains in each precious metal bull market are often several times those of gold, and the current gold-to-silver price ratio is still around 80:1, far below the historical average (around 60:1), meaning there is still room for silver to catch up.
3. Gold consolidates at highs: Technical adjustment and medium-term momentum accumulation
Gold's weekly performance shows a typical technical pattern of spiking, falling, then stabilizing. Gold encountered short-term profit-taking near $4,265, once retreating to $4,164, but after just two trading days, it regained the $4,200 level. This kind of "feigned dip" washout is often a means used by large funds to adjust positions before important events.
From a technical perspective, gold's ascending channel since October 2025 remains intact. The current price has comfortably held above the psychological level of $4,200, and the 20-day and 60-day moving averages have formed a golden cross. The MACD indicator is running above the zero line, with a clear bullish alignment signal. Resistance near the previous high of $4,265 has been tested, and once effectively broken, the next target will be directly at the historical high of $4,300.
The core logic driving gold upward has not changed. Global central bank gold buying remains active, with central banks in China, India, Turkey, and others continuing to increase gold reserves in Q4 2026. The dollar index has weakened under the pressure of rate cut expectations, hitting a near-three-month low, providing direct support for dollar-denominated gold. In addition, geopolitical risk premiums still exist, with tensions in the Middle East and potential friction in the Asia-Pacific region prompting some investors to hedge tail risks through gold allocation.
Notably, gold's year-to-date gains have reached 60%, a level rarely seen in history. During the bull market from 2001 to 2011, the average annual gold price increase was about 20%, while the current annualized increase far exceeds the average. This not only reflects drastic changes in the macro environment but also means short-term volatility may intensify. Investors need to be cautious: if the Fed meeting minutes release hawkish signals or real interest rates rebound, gold may face a correction of around 10%. However, in the medium term, as long as the rate-cutting cycle is not reversed, gold's upward trend will continue.
4. 60% annual gain: Review and outlook
This round of gold bull market began in Q4 2025. At that time, US inflation data fell from historical highs, but the Fed insisted on raising rates, leading to market concerns about "stagflation" and gold as a safe-haven asset began to attract funds. In early 2026, the aftermath of the Silicon Valley Bank incident had not fully dissipated, and the regional banking crisis once again triggered panic, pushing gold prices decisively through the $4,000 integer level. Thereafter, with repeated fermentation of the US debt ceiling issue and accelerated global central bank gold purchases, gold prices entered an accelerated upward phase in Q3 2026.
The current 60% annual increase is mainly attributed to the superposition of three factors: first, the transition from aggressive rate hikes to expectations of a rate pause, with real interest rates falling by about 150 basis points; second, the dollar index falling from a high of 105 to around 95; third, the continuous increase in global geopolitical risk premiums. Looking ahead to 2027, if the Fed starts a rate-cutting cycle as expected, gold is expected to benefit from the triple positive of "accommodative monetary cycle + weak dollar + safe-haven demand," reaching new highs.
But investors also need to stay sober. A 60% annual gain means gold has already partially priced in future rate cut expectations. If economic data comes in unexpectedly strong (e.g., an overheated labor market or inflation rebound), leading to delayed rate cuts, gold may face a phased correction. In addition, digital assets like Bitcoin have performed strongly recently, with some young investors shifting funds from precious metals to crypto assets, potentially diverting gold demand.
Conclusion: Seizing opportunities and managing risks in the next phase
The current precious metal market is at a critical window of macro expectation switching. The signal of silver hitting a record high cannot be ignored; it indicates that capital is spreading from safe-haven gold to silver with both industrial and financial attributes, often a sign that a bull market is entering a mid-term acceleration phase from early stage. Gold's stabilization near $4,200 has accumulated sufficient momentum to break through previous highs.
For investors, next week's Fed meeting will be a watershed for short-term trends. If the meeting releases a clear dovish signal, precious metal prices will usher in a new wave of advances; if ambiguous, profit-taking may be triggered. From a medium- to long-term perspective, driven by both the monetary easing cycle and the green energy revolution, the allocation value of gold and silver remains significant. It is recommended that investors maintain flexible positions, use pullbacks to gradually add positions, and closely watch silver's catch-up opportunities and the technical breakout confirmation of gold.
History does not simply repeat, but the rhythm of macro cycles can always enlighten us. When the bell for falling real interest rates rings, the precious metal bull market movement is just entering its climax.